Interface overview
The layout of Packet Tracer is divided into several components similar to a photo editor. Match the numbering in the following screenshot with the explanations given after it:
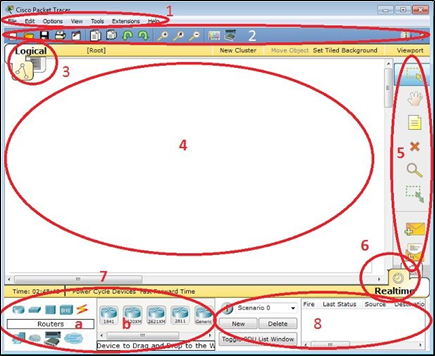
The components of the Packet Tracer interface are as follows:
- Area 1: Menu bar – This is a common menu found in all software applications; it is used to open, save, print, change preferences, and so on.
- Area 2: Main toolbar – This bar provides shortcut icons to menu options that are commonly accessed, such as open, save, zoom, undo, and redo, and on the right-hand side is an icon for entering network information for the current network.
- Area 3: Logical/Physical workspace tabs – These tabs allow you to toggle between the Logical and Physical work areas.
- Area 4: Workspace – This is the area where topologies are created and simulations are displayed.
- Area 5: Common tools bar – This toolbar provides controls for manipulating topologies, such as select, move layout, place note, delete, inspect, resize shape, and add simple/complex PDU.
Area 6: Realtime/Simulation tabs – These tabs are used to toggle between the real and simulation modes. Buttons are also provided to control the time, and to capture the packets.
- Area 7: Network component box – This component contains all of the network and end devices available with Packet Tracer, and is further divided into two areas:
° Area 7a: Device-type selection box – This area contains device categories
° Area 7b: Device-specific selection box – When a device category is selected, this selection box displays the different device models within that category
- Area 8: User-created packet box – Users can create highly-customized packets to test their topology from this area, and the results are displayed as a list.
